Why Map a Process?
Maps and flowcharts help make work visible. Increased visibility improves communication and understanding, and provides a common frame of reference for those involved with the work process. Maps are often used to show how work currently gets done in an organization. When used this way, they represent a snapshot in time that shows the specific combination of the functions, steps, inputs, and outputs that your organization uses to provide value to its customers. Thus, maps and flowcharts help you document your current pathways to customer satisfaction. Analysis of the process which the maps represent can help you increase customer satisfaction by identifying actions to reduce process cycle time, decrease defects, reduce costs, establish customer-driven process performance measures, reduce non-value-added steps, and increase productivity.
Defining Terms
Before we start discussing process maps, let's define some of the terms we'll be using:
-
Process
-
A series of steps or activities, used to achieve a specific purpose.
-
Map
-
A visual representation of the relationships between multiple elements.
-
Process Map
-
A work flow diagram that visually shows the steps or activities required to complete the process. Depending on the type of process, the process map may show people, equipment, measurement systems, and other resources required to complete the process.
-
Business Process Map
-
A diagram showing the people and resources involved in accomplishing what a business does, identifying their relationships, responsibilities, standards, and measurements of success.
-
Relationship Map
-
An overall view of an organization or multiple processes. For example, a relationship map for a business would show the various departments and how they interact with each other, with vendors, and with the business's customers.
-
Cross-functional Map ("Swim Lane Chart")
-
As part of a larger process map, this describes sub-processes within the larger process in greater detail.
The Purpose of Process Mapping
Most organizations do not understand process mapping, nor the value of making a process map. However, both the process map, and the process of making a process map provide valuable information.
Making a process map requires thinking through the process, looking at each step, and analyzing what is accomplished in each step. The act of creating the process map can itself reveal problems, bottlenecks, and waste. A methodical, step-by-step documentation of the process will result in a better understanding of the process, and easier identification of ways to improve the process.
The process map is a tool to document a process visually. This is much simpler and less time-consuming than documenting the process in written text. In addition, the visual process map is easier to understand and provides a better overview of the process, in comparison to text.
A process map's visual overview allows relationships to be seen, and makes it easier to spot problems. It provides a "show me" tool that makes documenting and explaining problems easier. This simplifies analysis of the process, and makes it easier to identify points in the process where there is waste or the need for improvement.
As modifications to a process are proposed, the process map shows the relationships to other parts of the process, allowing the impact of the modifications to be better analyzed.
Principles of Process Mapping
The following are some of the basic principles to be applied when making a process map.
-
Genchi Genbutsu is a Japanese term that means "go and see." Don't try to create a process map by just sitting in a conference room. Go out and see ? physically walk through the process ? and observe how it works. Talk with those who are involved with the process to learn details. This will help to identify "hidden steps" that are needed to make the process work, and to identify problems you might have otherwise missed.
What is a "hidden step?" This is an activity or informal fix that workers carry out, but that is not documented. The extra step may be necessary for the process to work, or it may make the process more efficient, or safer. For example, an industrial process might involve receiving five-gallon cans of paint, to be poured into a painting machine. The worker who pours the paint has found that it is necessary to stir the paint before pouring it into the machine, which results in a more consistent paint spray. This is a hidden step.
-
A process map should document exactly what the process is like, not what you'd like the process to be. A process map should be an accurate document showing reality, with all of its flaws, blemishes, issues, and problems.
-
A process map is dynamic, and needs to be easy to change. One way to make a process map is by using large board and magnetic "labels." These can be made using your DuraLabel printer. The magnetic labels can be moved about and changed as needed. Another, more temporary option is a whiteboard and dry erase markers.
-
Whatever method is used to present the process map, it must be visual and large enough for a group to see it. Process maps are done on walls, not letter-size sheets of paper.
-
A process has a beginning and an end, and all process maps must have a beginning (start) and end point (stop).
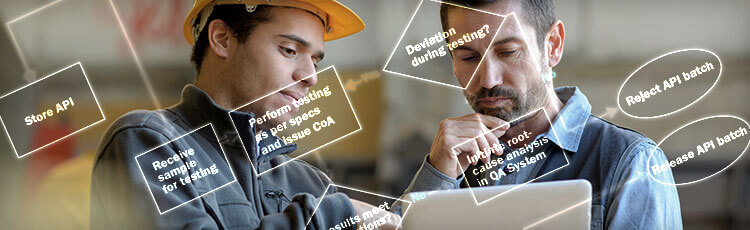
Process Map Symbols
There are four types of symbols used in a process map. These are:
-
Oval
-
shows the inputs to a process, and the final output from the process. Inputs may include materials, components, energy, information, or commands from a worker.
-
Rectangle
-
shows tasks and activities performed by people involved in the process. In some processes, there may also be tasks and activities performed by robots. Although there a given task (rectangle) may have multiple inputs, there is typically only one output from each task.
-
Diamond
-
shows a decision point. This can be a a point where a yes/no decision is made, or a point at which a question is asked. A decision point usually has one input and multiple outputs. For example, a yes/no decision point will have two outputs: one showing what happens if the answer is "yes," and the other showing what takes place if the answer is "no."
-
Circle
-
indicates a break in the process map. It usually happens because there is no room to continue the map at that point. The circle will contain a letter or number, and there will be a corresponding circle with the same letter or number in another location, where this portion of the process map continues.
Making a Process Map
The following are the seven steps to creating a process map.
- Identify the process that needs to be mapped. Processes can be industrial, administrative, or used to provide a service. Even the process of mapping processes can be mapped.
- Establish the objective of processing mapping. Is it simply to document the process, or is process mapping being used to solve specific problems with the process?
- Select the process mapping team. Process mapping involves a variety of people, including those who are familiar with the operation of the process, as well as with its maintenance and its design. It can also be helpful to include people who are not directly involved with the process, because their unbiased perspective can find details that people familiar with the process might overlook.
- Agree on what will be done. For example, how detailed will the process map be? Will swim lane charts be used to provide greater detail in some areas? What are the beginning and end points of the process?
- Create an initial draft process map. The process mapping team should create this initial draft based only on their existing knowledge of the process. It provides a framework on which a more detailed process map can be built.
- Add the details. For larger processes, this may involve assigning team members to different parts of the process. Each team member might then go out and observe the process, and talk with those involved in making the process work. The objective is to identify all inputs, decision points, and tasks that are a part of the process. In addition, cycle time delays, in-process inventory build-ups, and other areas where improvements can be made should also be noted for inclusion on the process map. For example, the following types of questions might be asked:
- What parts of your job are the most difficult? Which are the most time-consuming?
- What parts of your job cause the most problems? What parts of your job would you like to eliminate?
- In what parts of your job do you see the most quality problems?
- What "special" things do you do to make your job easier?
- Are there steps in the process you skip? What if there is a rush, are there steps that can be skipped?
When talking with workers, be sure they understand that this is not a job evaluation. Honest information about how the process really works needs to be collected.
- Evaluate and review. Once the information has been collected and used to build the process map, evaluate what the process map is showing and identify areas were more information is needed. It may take a number of iterations to create a process map that the team feels accurately reflects the reality of the process, and that meets the original objectives for this process map.
Process Maps, Visual Communication, and DuraLabel
DuraLabel printers are not only valuable tools for making a process map; you'll find your printer to be a valuable tool tool help solve the problems identified by a process map. DuraLabel custom label printers and tough-tested supplies create needed signs, labels, and tags to provide code-required messages, as well as providing the visual communication needed to eliminate waste and improve efficiency. Call 888.326-9244 today to learn more about DuraLabel printers and supplies. Be sure to ask about the special DuraLabel kits to save money and time.
Learn every step of the 5S philosophy, and get started with our free guide on 5S best practices below.