03
February,
2023
3 MINUTE READ
Electrical injuries at work are a serious issue, even though the number of associated fatalities has steadily decreased over the last few decades. Who's at risk of these injuries, and what's the cost? This infographic dives into the details from a collection of studies, highlighting major trends in electrical injuries.
The following is a transcript of the Electrical Injuries Infographic:
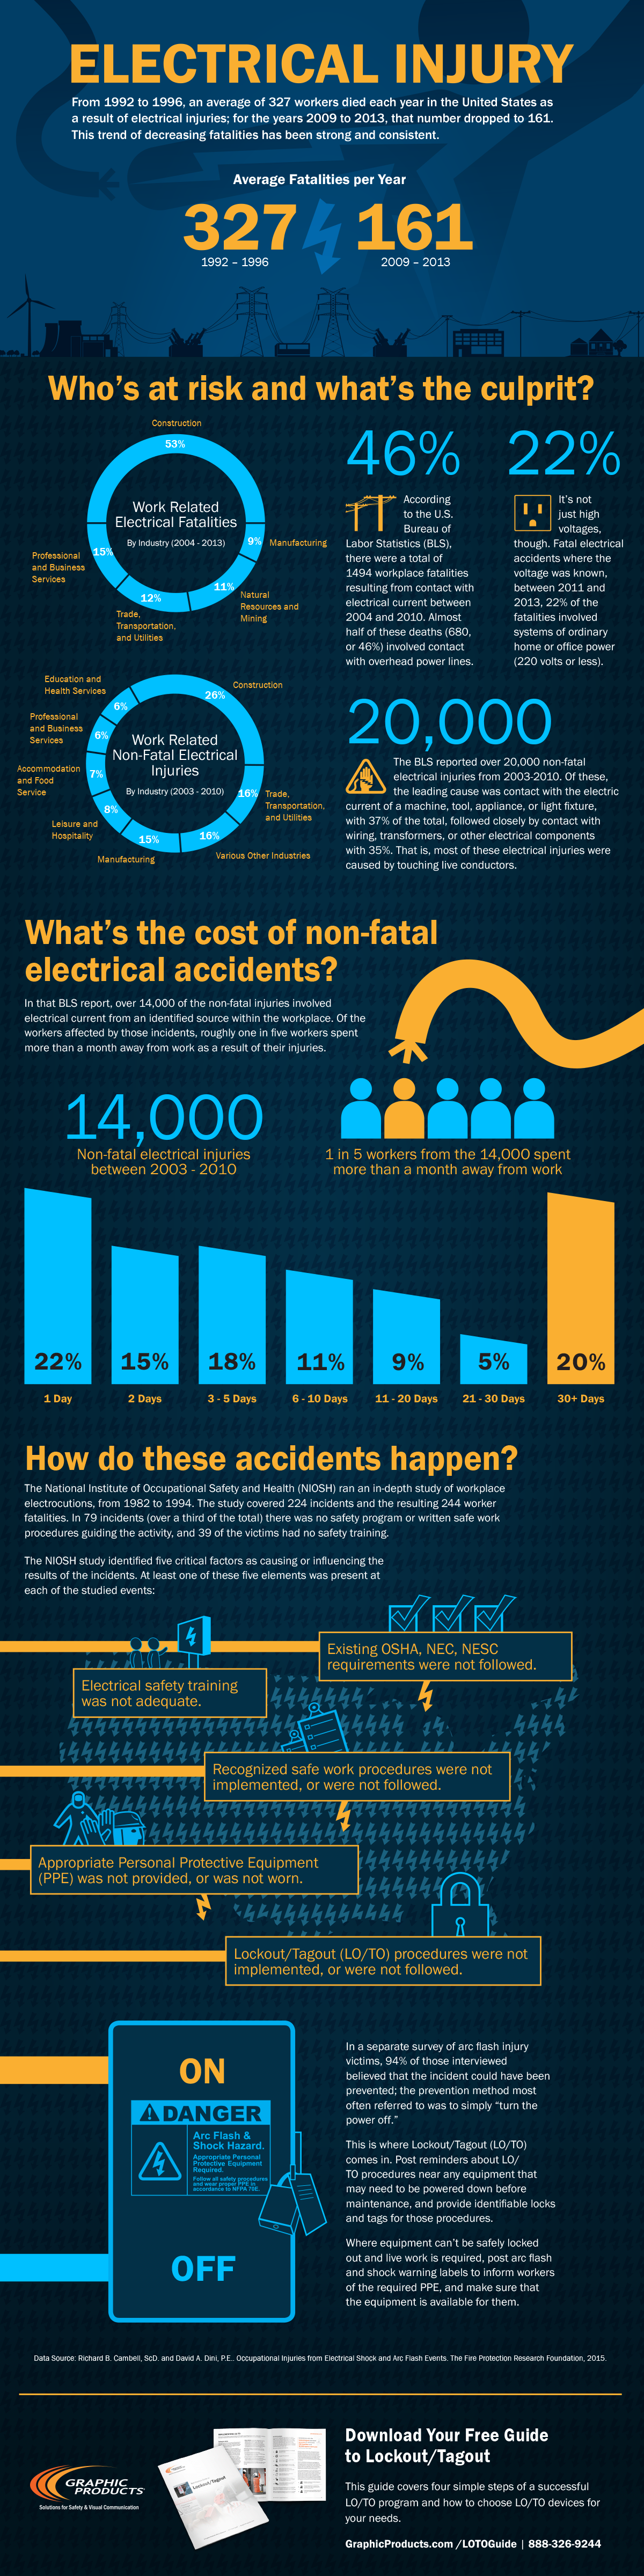
From 1992 to 1996, an average of 327 workers died each year in the United States as a result of electrical injuries; for the years 2009 to 2013, that number dropped to 161. This trend of decreasing fatalities has been strong and consistent.
Average Fatalities per Year
- 1992-1996: average of 327 fatalities/year
- 2009-2013: average of 161 fatalities/year
That's still a lot of deaths, though.
Who's at risk and what's the culprit?
Work-Related Electrical Fatalities, By Industry (2004-2013)
By a long shot, construction workers are most at risk of death from electrical accidents.
- Construction: 53%
- Professional and Business Services: 15%
- Trade, Transportation, and Utilities: 12%
- Natural Resources and Mining: 11%
- Manufacturing: 9%
Work-Related Non-Fatal Electrical Injuries, By Industry (2003-2010)
Non-fatal electrical injuries affect a far wider range of workers.
- Construction: 26%
- Trade, Transportation, and Utilities: 16%
- Manufacturing: 15%
- Leisure and Hospitality: 8%
- Accommodation and Food Services: 7%
- Education and Health Services: 6%
- Professional and Business Services: 6%
- Various Other Industries: 16%
What's the culprit?
Fatal Accidents:
According to the U.S. Bureau of Labor Statistics (BLS), there was a total of 1494 workplace fatalities resulting from contact with electrical current between 2004 and 2010. Almost half of these deaths (680, or 46%) involved contact with overhead power lines.
It's not just high voltages, though. Fatal electrical accidents where the voltage was known, between 2011 and 2013, 22% of the fatalities involved systems of ordinary home or office power (220 volts or less).
Non-Fatal Accidents:
The BLS reported over 20,000 non-fatal electrical injuries from 2003-2010. Of these, the leading cause was contact with the electric current of a machine, tool, appliance, or light fixture, with 37% of the total, followed closely by contact with wiring, transformers, or other electrical components with 35%.
That is, most of these electrical injuries were caused by touching live conductors.
What's the cost of non-fatal electrical accidents?
In that BLS report, over 14,000 of the non-fatal injuries involved electrical current from an identified source within the workplace. Of the workers affected by those incidents, roughly one in five workers spent more than a month away from work as a result of their injuries:
- 22% 1 Day
- 15% 2 Days
- 18% 3-5 Days
- 11% 6-10 Days
- 9% 11-20 Days
- 5% 21-30 Days
- 20% 31+ Days
How do these accidents happen?
The National Institute of Occupational Safety and Health (NIOSH) ran an in-depth study of workplace electrocutions, from 1982 to 1994. The study covered 224 incidents and the resulting 244 worker fatalities. In 79 incidents (over a third of the total) there was no safety program or written safe work procedures guiding the activity, and 39 of the victims had no safety training.
The NIOSH study identified five critical factors as causing or influencing the results of the incidents. At least one of these five elements was present at each of the studied events:
- Recognized safe work procedures were not implemented, or were not followed
- Appropriate Personal Protective Equipment (PPE) was not provided or was not worn
- Lockout/Tagout (LO/TO) procedures were not implemented or were not followed
- Existing OSHA, NEC, or NESC requirements were not followed
- Electrical safety training was not adequate
In a separate survey of arc flash injury victims, 94% of those interviewed believed that the incident could have been prevented; the prevention method most often referred to was to simply "turn the power off."
This is where Lockout/Tagout (LO/TO) comes in. Post reminders about LO/TO procedures near any equipment that may need to be powered down before maintenance, and provide identifiable locks and tags for those procedures.
Where equipment can't be safely locked out and live work is required, post arc flash and shock warning labels to inform workers of the required PPE and make sure that the equipment is available for them.
Data source: Richard B. Campbell, ScD. and David A. Dini, P.E.. Occupational Injuries from Electrical Shock and Arc Flash Events. The Fire Protection Research Foundation, 2015.
RELATED RESOURCES
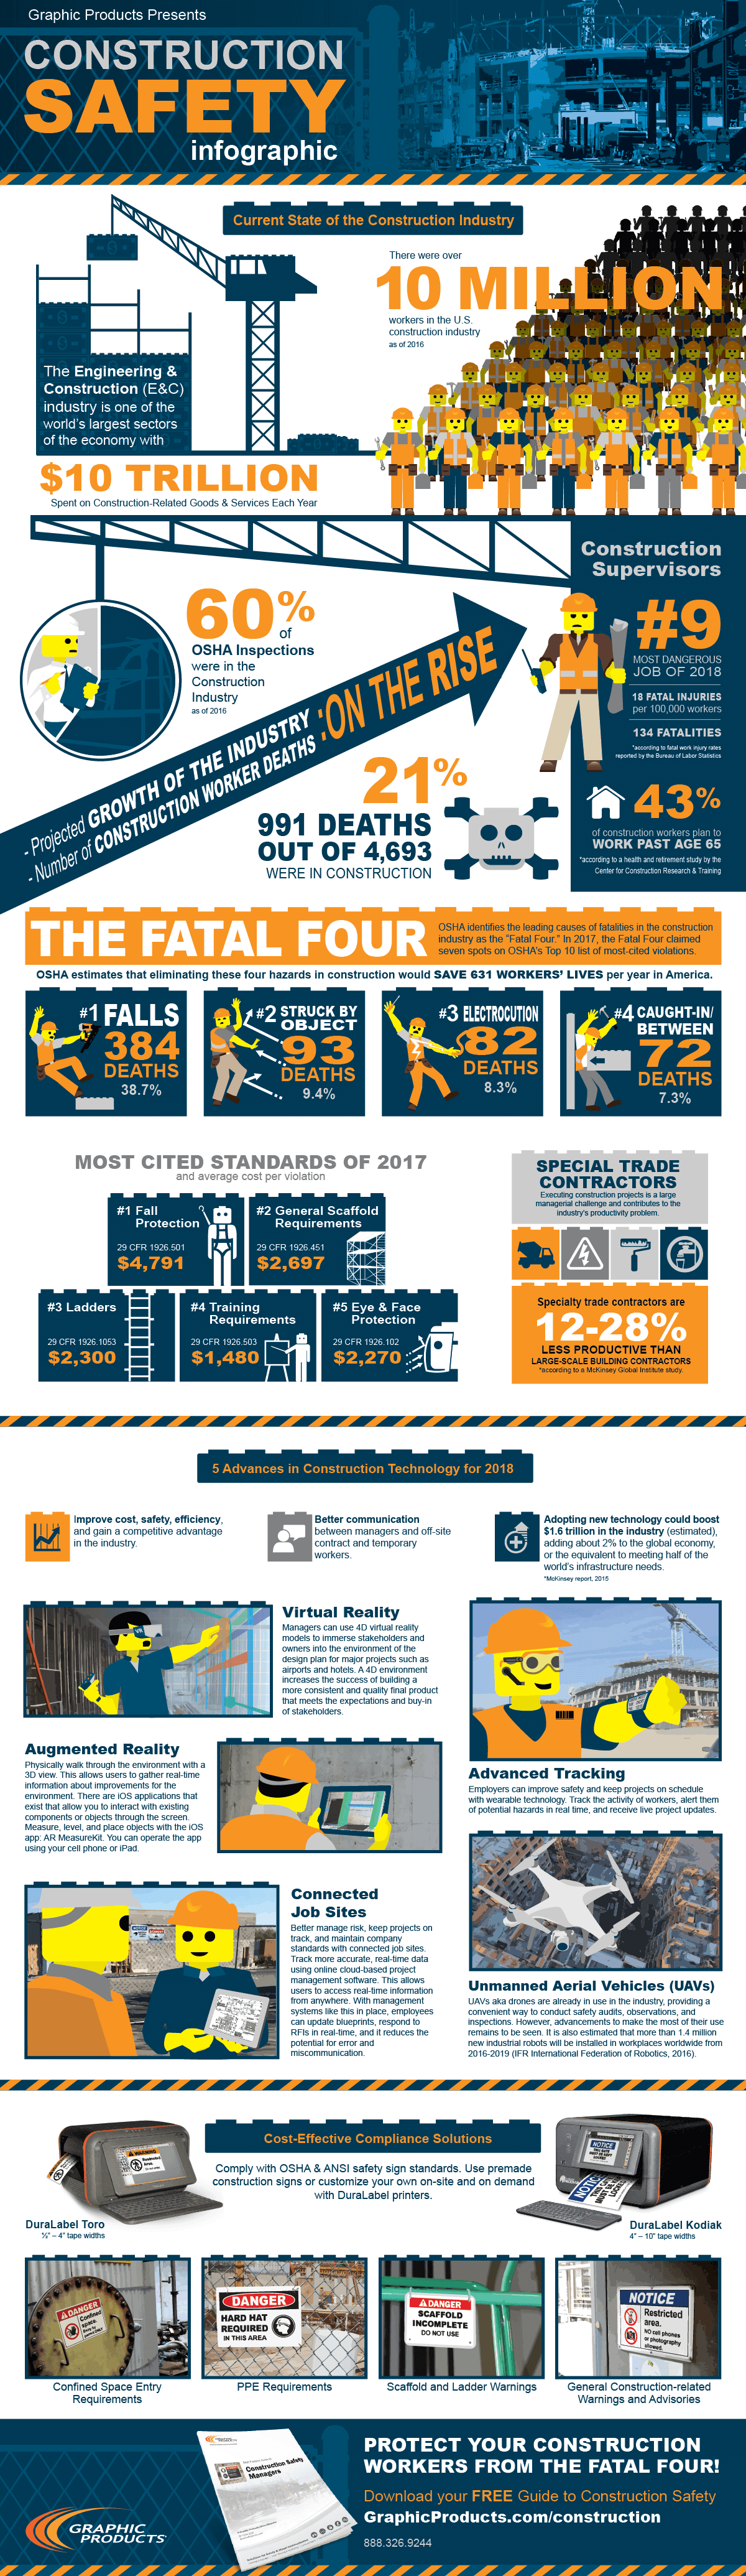
Construction Safety
Work dynamics in the construction industry are shifting more than ever due to increasing temporary and ...
Read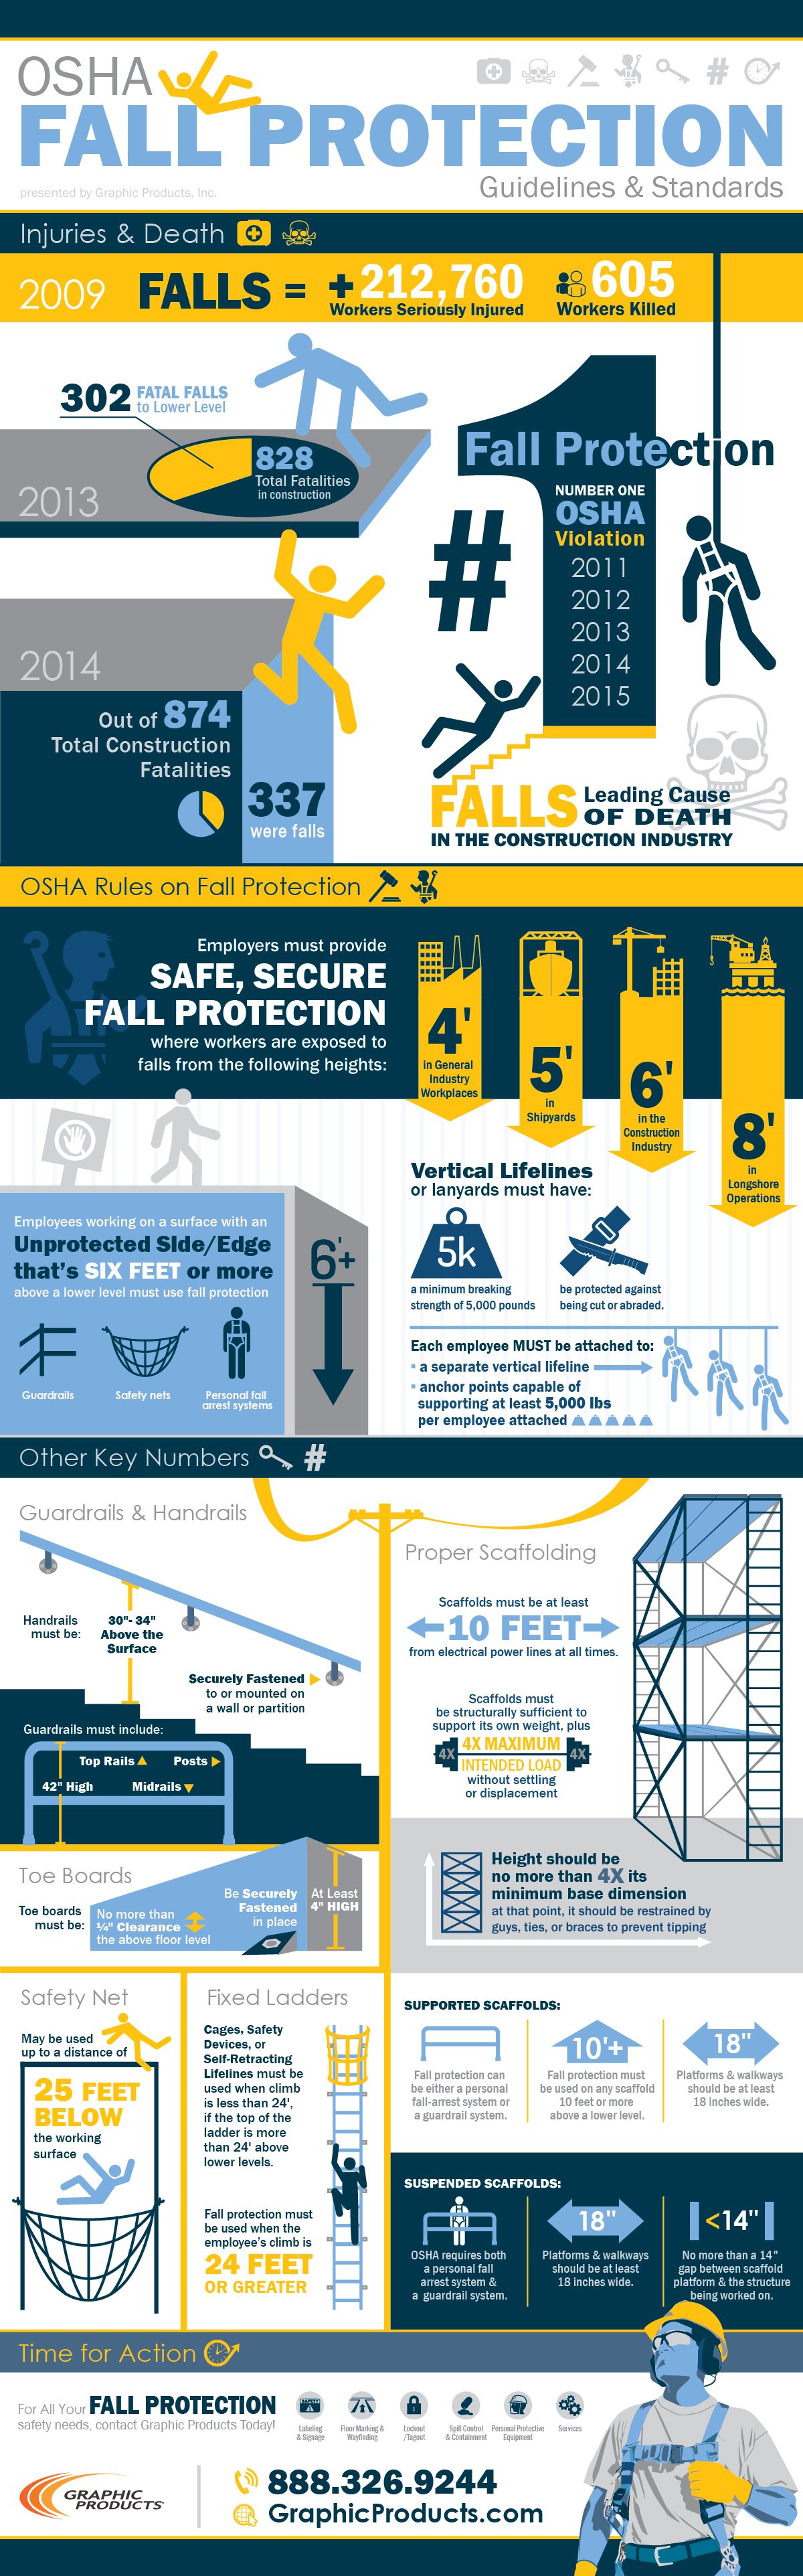
OSHA Fall Protection Guidelines
Missing or ineffective fall protection is routinely OSHA's most common violation, and falls are the leading ...
ReadOSHA Fall Protection Equipment
In 2014, 818 U.S. workers died from slips, trips, and falls-the highest such number in nearly a decade-and ...
Read