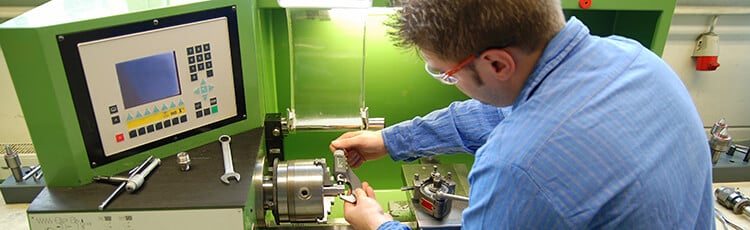
The quality circle originated in Japan in the early 1960's. The objective was to give the responsibility for identification and resolution of quality problems to those working on the factory floor. This was in line with the basic philosophy of the Toyota Production System (TPS), that problem solving should take place on the shop floor where the work is done.
What is a Quality Circle?
A quality circle is a small group of employees who have volunteered to meet periodically to discuss quality problems. The groups usually consist of three to twelve individuals. Meetings typically last about an hour and are held during paid time, at least once a month but usually once a week. The exact timing and duration of meetings varies, depending on the type of problems being addressed.
The members of a quality circle typically come from the same department or work area, and the quality circle is led by their supervisor. However, successful quality circles often include some members from outside the area being targeted for improvement.
The person appointed to lead the quality circle runs the meetings in an orderly manner. Minutes are taken to document the discussions, creating a record of the problems identified and the solutions proposed. These notes provide the basis for proposals to be submitted to management.
Because most members of a quality circle come from the work area being examined, many changes can be implemented immediately. The underlying idea is to use the principles of Kaizen to generate a continuous stream of suggestions for small improvements that can be quickly applied.
Keys to Success: Training and Support
The goal of the quality circle is to identify quality problems and create solutions to those problems. To meet that goal, the members of the quality circle need training in a specific set of skills. The training of circle/Kaizen leaders and members is the foundation of all successful programmes. The whole basis of the training operation is that the ideas must be easy to take in and be put across in a way that facilitates understanding. Simplicity must be the key word, with emphasis being given to the basic techniques. Essentially there are eight segments of training:
1. Introduction to quality circles
2. Brainstorming
3. Data gathering and histograms
4. Cause and effect analysis
5. Pareto analysis
6. Sampling and stratification
7. Control charts
8. Presentation techniques
This quote from Total Quality Management: Text with Cases, by John S. Oakland, mentions "circle/Kaizen." Successful quality circles incorporate the principles of Kaizen as the basis for identifying and solving quality problems. This means that Quality Circle members must be thoroughly familiar with Kaizen and how to use Kaizen in the workplace.
In addition to training, the other key factor for success is management support. In some cases someone from management is assigned to be a part of the Quality Circle. However, this usually results in the manager dominating the quality circle meetings, when what is needed is input from the people actually doing the work. What is required from management is:
- Take quick action on quality circle recommendations.
- Provide an adequate budget for the quality circle.
- Support the training of members of the quality circle.
- Provide authorization to get assistance from other departments.
- Facilitate communication between quality circles in different departments.
- Pick significant projects with measurable goals.
- Although the quality circle concept has gained considerable momentum in the United States, many organizations are finding that quality circles are not the panacea most people believed they would be. Quality circles offer a number of advantages, but they also have certain limitations. The problems most frequently encountered include a tendency for the quality circle concept to fade away if not nurtured in adequate training, nonparticipation, inadequate technical expertise for the problems taken on by the quality circle, and a lack of focus.
It is the job of management to "nurture" Quality Circles, and provide the resources, training, and support quality circle members need.
Quality Circle Training Topics
Let's take a closer look at the areas that need to be targeted for training.
What is Brainstorming?
Brainstorming is a technique used to generate ideas, allowing for free input even when that input is impractical or unorthodox. The goal is to generate ideas, without filtering, criticizing, or limiting those ideas in any way. After the ideas have been shared, they can be discussed and modified for eventual use.
Brainstorming may be done in a number of ways. For example, members of the Quality Circle may explain their ideas as they occur to them, speaking out as they have a thought. Brainstorming may be more structured, with the Quality Circle leader calling on each team member in turn, soliciting their ideas. The process can be used to identify possible causes of a problem. It is also used to develop suggestions for solutions to that problem. Whenever ideas are needed, brainstorming is a technique that can be used to generate those ideas.
What are Data Gathering and Histograms?
In order to analyze a problem, data is needed. The more relevant information is available, the better the opportunity to come up with a good solution. Since members of a quality circle are the people doing the work, in many cases they can collect the needed data. However, collecting valid data requires familiarity with sampling techniques so that the data stays relevant and accurate. Data gathering is its own field of study.
A histogram, one central element of data gathering, is a graph showing the distribution of data. This visually presents the number of data points that fall within different ranges of values. For example, one quality circle is measuring the length of a product; the desired length is 15 inches, and the data collected for an 8-hour day of production shows that the system is producing an average length of 15 inches. But customers are complaining about quality. What is the problem? A histogram could show that, while the average output is correct, a large number of units are being measured at 13 and 17 inches - well out of specification.
What is a Cause-and-Effect Analysis?
Cause-and-Effect Analysis is a technique used to identify all the possible causes of a certain effect, not just the most obvious causes. The process creates a diagram, often called a fishbone diagram or an Ishikawa diagram, to visualize the connections and causes that are discussed. they begin with identifying the problem. The problem is written on the left side of a sheet of paper, and a horizontal line is drawn leading from that definition across the page. Possible causes of the problem are brainstormed and drawn as smaller lines connected to the horizontal line, creating a fishbone pattern. Contributing causes can then be added to each individual cause in the same way. This may be done several times, creating a final diagram three or four layers deep.
After the initial diagram is created, each cause can be investigated and analyzed. The result is that the quality circle can identify which cause or causes are actually contributing to the problem, so that those causes can be addressed.
What is Pareto Analysis?
Pareto analysis is a technique that helps to organize thoughts and ideas. It is used to identify the important problems and separate them from the trivial problems. Based on the "Pareto Principle" - the idea that 80% of the results are produced by 20% of the effort - the objective of Pareto analysis is to identify the few problems that, when resolved, result in most of the possible improvement.
Pareto analysis involves identifying problems and rating them based on the severity of their impact. Then the root cause of each problem is identified. The problems are grouped together based on their root cause, and the ratings for the problems in each group are totaled. The root cause with the highest total rating is the top priority.
The completed analysis is often presented using a bar graph with each column representing a root cause. The columns are arranged from the tallest to the shortest, making it easy to see the priority for addressing the root causes.
What is Sampling and Stratification?
At times it may be difficult to identify the cause of a problem, in particular if there are many possible contributing factors. In those cases it can be useful to use stratified sampling. Instead of measuring the total output of the process as a whole, samples (or measurements) are made at each step along the way. In effect, the quality circle is separating the problem into layers, and examining each layer separately.
For example, a product goes through five manufacturing operations in the course of its production, and the end result is not meeting quality specifications. Each of the five manufacturing operations can be examined separately. It may turn out that a small error in an early step of manufacturing the product is causing significant problems further down the line.
What is a Control Chart?
A control chart is a set of graphs that record the quality of a product or service. One line marks the average output of the process, and two additional lines mark the upper and lower control limits. When the process produces falls outside those boundaries, or meets certain other criteria that indicate inconsistency, then there is a problem that needs to be addressed. Often, one graph will show average measurements of a product, and a second graph will show the spread of those measurements within a test set.
Why are Presentation Techniques (Communication Skills) Important?
Communication skills are important. The quality circle may identify problems, and come up with excellent solutions, but if they cannot effectively communicate with those who approve budgets (management) and authorize changes to equipment and processes (engineering department), even the best plans are only wasted effort. The quality circle must be able to effectively communicate their findings and recommendations.
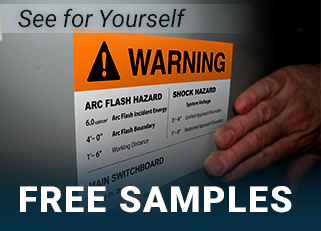
Looking at Labels and Signs
Labels and signs can be a forgotten aspect of quality. When they are properly used, they effectively deliver important information where and when it is most needed. But missing labels and signs may not be noticed, resulting in problems that can be difficult to diagnose. For example, when Joe is on vacation the defect rate goes up. Why? Because Joe knows to lubricate the machine every three hours. But the label reminding the machine operator about the lubrication times is missing, and the fill-in operator is not aware that there is a problem at all. Conducting an annual inspection to look for faded, damaged, peeling, or missing labels and signs should be a part of the normal maintenance routine.
To ensure labels and signs are long-lasting, a DuraLabel printer should be a part of every maintenance shop. With DuraLabel you get quality that can't be beat, and warranties that back up those claims. Call us today for more information about DuraLabel custom label printers and tough-tested supplies.
Leverage Quality Circles for Continuous Improvements
Utilizing the TPS, Kaizen, Lean and other organizational frameworks can help boost efficiency, productivity, morale, as well as reduce accidents. Get your copy of our free Kaizen Best Practice Guide below!